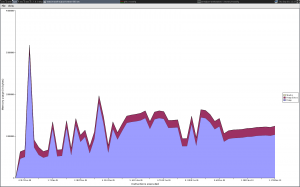
Another day, another release. This release fixes:
- Missing axis labels – now it is explicit what each axis represents
- Inconsistencies with GNOME HIG: Button ordering in save/open dialog and missing ellipsis for menu actions which require further user input
- A error message on canceling in the save dialog which should not have been there
Ubuntu 10.04 packages are now in the Openismus PPA. Due to scheduled downtime for Launchpad it might take an hour or two before they are built. The tarball is here, Fedora 13 packages here (i686, x86_64). Arch packages are still in AUR, and Gentoo packages in Dave’s overlay.
I’ve updated the README to include information about the roadmap and tasks to be done. Check it out if you’re interested in improving this small tool.
Hopefully there will be a massifg product in GNOME bugzilla soon (I’ve made a request), but in the meantime just report problems to me by email.

Hi,
It’s not a good idea to use GogLinePlot for such graphs, as the X axis will just display the X data as labels, without taking into account the real value for the placing of the data points.
A GogXYPlot is more appropriate. Here’s a patch that makes massifg use it (it doesn’t stack plots, but that’s easy to implement):
— a/src/massifg_graph.c
+++ b/src/massifg_graph.c
@@ -123,10 +123,23 @@ data_from_snapshots(GList *snapshots, MassifgDataSeries series) {
void
massifg_graph_add_series(MassifgGraph *graph, GOData *name, GOData *x, GOData *y) {
GogSeries *gog_series = gog_plot_new_series(graph->plot);
+ GOStyle *style;
gog_series_set_name(gog_series, (GODataScalar *)name, NULL);
gog_series_set_dim(gog_series, 0, x, NULL);
gog_series_set_dim(gog_series, 1, y, NULL);
+
+ gog_series_set_fill_type (gog_series, GOG_SERIES_FILL_TYPE_Y_ORIGIN);
+
+ style = go_styled_object_get_style (GO_STYLED_OBJECT (gog_series));
+
+ style->fill.type = GO_STYLE_FILL_PATTERN;
+ style->fill.auto_type = FALSE;
+
+ go_marker_set_shape (style->marker.mark, GO_MARKER_NONE);
+ style->marker.auto_shape = FALSE;
+
+ go_styled_object_style_changed (GO_STYLED_OBJECT (gog_series));
}
/* Adds all the simple data series to graph
@@ -429,8 +442,7 @@ massifg_graph_new(void) {
chart = go_graph_widget_get_chart(GO_GRAPH_WIDGET(graph->widget));
/* Create a plot and add it to the chart */
– graph->plot = (GogPlot *)gog_plot_new_by_name(“GogAreaPlot”);
– g_object_set (G_OBJECT (graph->plot), “type”, “stacked”, NULL);
+ graph->plot = (GogPlot *)gog_plot_new_by_name(“GogXYPlot”);
gog_object_add_by_name(GOG_OBJECT (chart), “Plot”, GOG_OBJECT(graph->plot));
Yes, a X-Y plot is more correct, but I did not find a way for it to show areas. This patch solves that, thanks!